

See what your panel could be earning.In two minutes.
CareAtlas runs RPM, CCM, TCM, and APCM end-to-end — and Medicare pays for every one of them. Most hospitals and practices already have the eligible patient population. What they don't have is a credible operating model. The calculator below shows what the revenue looks like once that operating model is in place. Revenue varies by program mix, volume, and payer. Not a guarantee of income.

Enter your panel. We'll do the math.
Three inputs. Two outputs. The math is the same 2026 Medicare Physician Fee Schedule math you'd run yourself — applied to your panel size and program mix.
2026 Medicare rates. National averages. No magic.
Every number the calculator returns is derived from the published 2026 Medicare Physician Fee Schedule. We round to a national average and apply national-average eligibility ratios to estimate how much of your panel qualifies for each program. The exact mix you'll see depends on your locality, your population's clinical profile, and which programs you ultimately run.
APCM - Advanced Primary Care Management
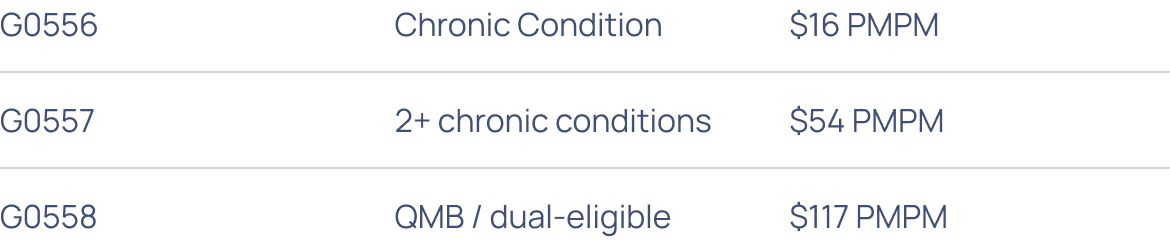
2026 base codes G0556 (1 chronic condition · ~$16 /patient/mo), G0557 (2+ chronic conditions · ~$54 /patient/mo), and G0558 (QMB / dual-eligible · ~$117 /patient/mo). New for 2026: G0568 / G0569 / G0570 add-ons for behavioral health integration and collaborative-care management when an APCM base code is reported in the same month. No time-tracking requirement — APCM is structured around qualifying care-plan elements.
CCM - Chronic Care Management
2026 codes 99490 (first 20 minutes · ~$66 /patient/mo), 99439 (each additional 20 minutes · ~$50), 99487 (complex CCM first 60 minutes · ~$144 /patient/mo), 99489 (complex CCM each additional 30 minutes), and 99491 (physician-delivered CCM, 30 minutes). 2026 saw approximately a 10% reimbursement increase versus 2025 for non-complex CCM.
.webp)
RPM - Remote Patient Monitoring
2026 codes 99453 (device setup + education · ~$22 one-time), 99454 (device supply, 16+ days transmission · ~$52 /patient/mo), 99457 (clinical staff monitoring, first 20 minutes · ~$48–52), 99458 (each additional 20 minutes · ~$41–52). New for 2026: 99445 (device supply for 2–15 days at the same rate as 99454) and 99470 (treatment management, 10–19 minutes — a shorter-duration threshold than 99457's 20-minute floor).
.webp)
TCM - Transitional Care Management
2026 codes 99495 (moderate complexity · 2 business day contact + 14-day face-to-face) and 99496 (high complexity · 2 business day contact + 7-day face-to-face). TCM is a 30-day episode following discharge. Nationally, most eligible discharges still go unbilled for TCM — and more than half of unbilled episodes already had a qualifying office visit inside the 14-day window. The revenue is recoverable.
.webp)
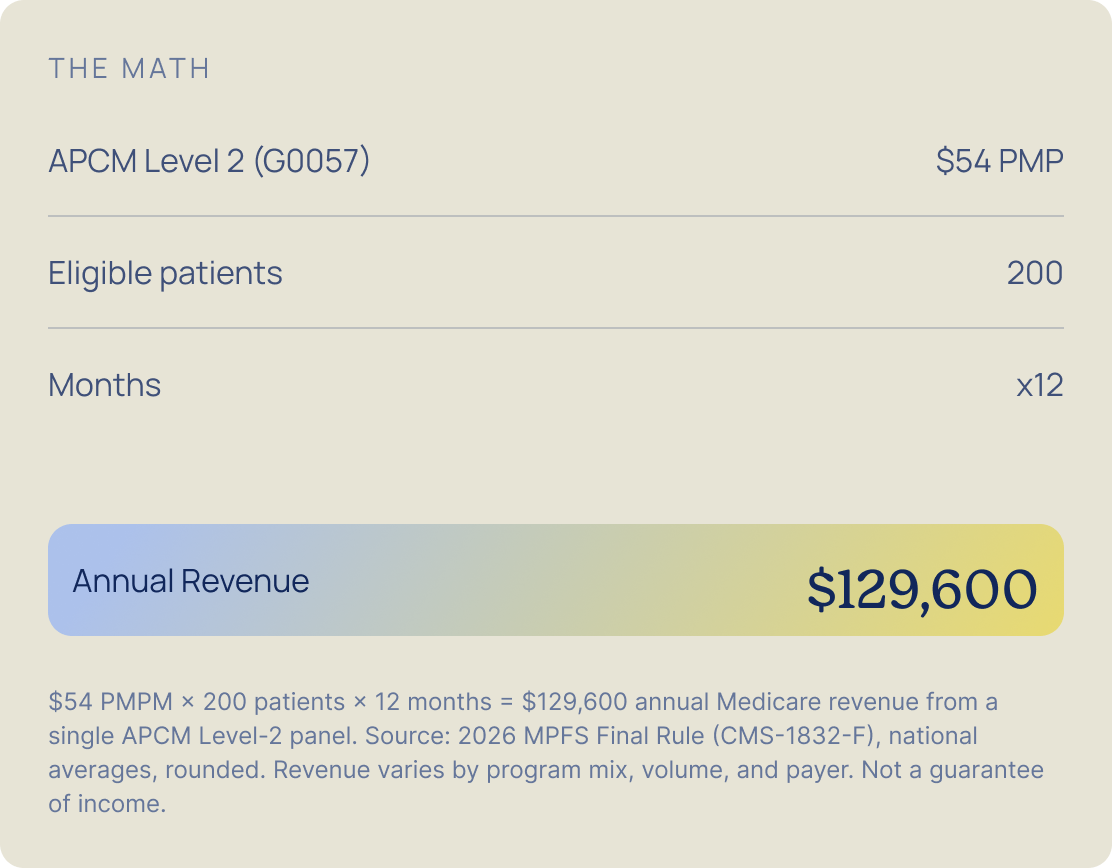
A 200-patient APCM Level-2 panel.
The cleanest illustration of why APCM is the program most partners start with — and why "approximately $54 /patient/mo" matters more than it sounds.
A primary care practice with 200 patients qualifying for APCM Level 2 (G0557 — 2 or more chronic conditions) bills approximately $54 per patient per month, or approximately $129,600 in annual Medicare revenue from that single program, with no time-tracking requirement. Add RPM and CCM for the subset of those patients whose clinical need requires them, and per-patient /patient/mo stacks materially higher. The calculator above lets you swap your real panel size in.
Three operating models. Pick the one that fits how you're staffed.
The calculator returns the gross Medicare revenue your panel could generate. How that revenue lands at your organization depends on which CareAtlas model you operate under. All three run on HealthQuilt.
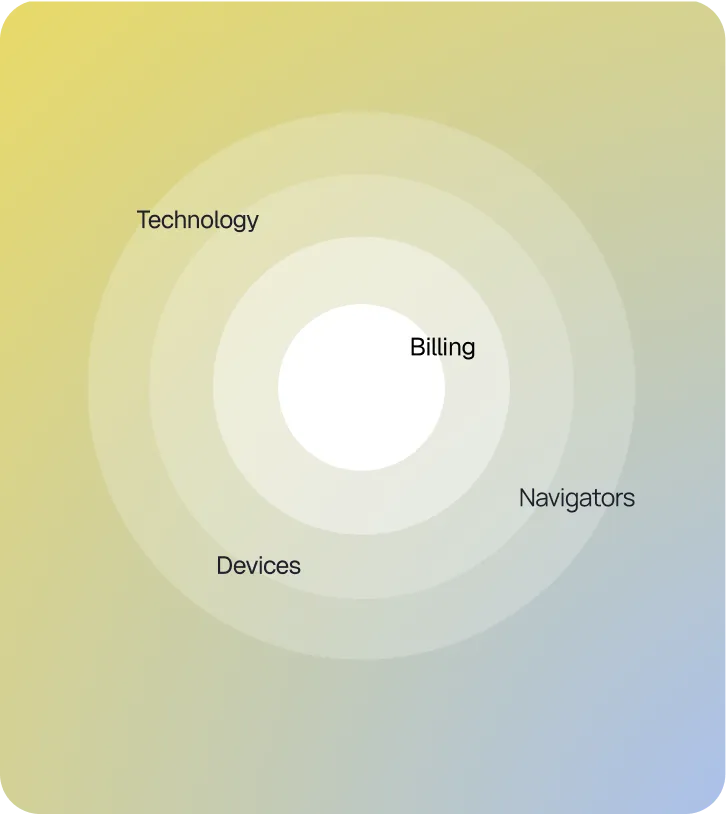
Complete · We run everything. You refer.
CareAtlas provides the navigators, the clinicians, the devices, the platform, the documentation, and the billing. For hospital partnerships, CareAtlas serves as provider of record under the affiliated professional corporation — no upfront investment, no new hires required from the hospital. For practices, your practice stays provider of record and captures $50–$120 /patient/mo in new Medicare revenue per enrolled patient.
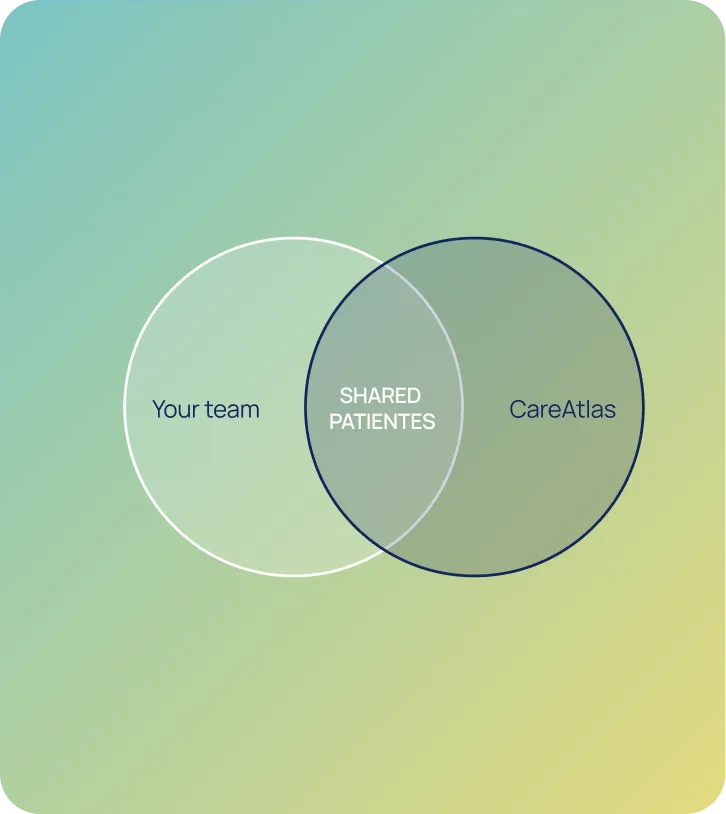
Extend · We augment the team you already have.
Your in-house care-management team stays in the lead. CareAtlas's HealthQuilt platform, device logistics, and overflow navigator capacity fill the gaps. Billing stays with your existing RCM — your organization retains the Medicare reimbursement and pays for the platform and overflow capacity as a service.
Connect · Platform-only. You bring the team.
You operate the care team. CareAtlas provides the HealthQuilt coordination layer across every contracted provider in your network — so attribution holds, documentation is consistent, and outcomes are comparable across sites. Billing stays with your contracted providers.
The programs pay. The operating capacity is what's missing.
Nationally, only 4% of eligible Medicare patients are enrolled in Chronic Care Management. Most eligible discharges still go unbilled for TCM — and more than half of the unbilled ones already had a qualifying office visit in the 14-day window. The Medicare programs that pay for chronic-care coordination work were designed for organizations with staff to spare. Most hospitals and practices don't have the staff. CareAtlas is the operating capacity those organizations didn't have — delivered as a partnership with no upfront investment and no new hires required for hospitals, and with a 60-day public commitment from signature to first enrolled patient.

Patient enrollment is run by CareAtlas, not your team.
Eligible patients receive an outreach call from a named care navigator. Consent is captured structurally. Enrollment lands in HealthQuilt and is visible to your team without anyone having to chase paperwork.

Documentation is captured as the work happens.
Every minute, every qualifying touch, every required element of a CCM / TCM / APCM encounter is logged in HealthQuilt during the call. Month-end is a report, not a reconstruction project.

Billing is clean before it leaves the platform.
Hospitals: CareAtlas submits claims under the affiliated professional corporation's NPI. Practices: HealthQuilt exports a clean, scrubbed batch into your existing RCM. The denials rate on a structured-capture workflow is materially lower than on retroactive time-attestation workflows.
The fine print, in plain English.
.svg)
2026 Medicare Physician
Fee Schedule
What the calculator assumes. Rates: CY2026 Medicare Physician Fee Schedule national non-facilityamounts (CMS-1832-F). Eligibility: national-average shares of Medicare beneficiaries by chroniccondition count and QMB enrollment (sources listed below the calculator). Enrollment: annualized atfull enrollment of the eligible panel; real programs ramp over the first two quarters. Locality: yourMedicare Administrative Contractor's rates may differ from national averages by roughly ±15%.Programs: APCM and CCM are never billed together for the same patient in the same month; RPMmay be added to either; TCM is episode-based and not modeled here.
.svg)
Locality
variation
Medicare reimbursement varies by locality per Medicare Administrative Contractor. National averages used in the calculator may differ from your locality's exact rate by approximately ±15%.

Eligibility
ratios
Eligible-panel sizing is estimated from national averages for each program — APCM eligibility is broad (most Medicare patients with 1+ chronic conditions), CCM and RPM eligibility narrows by clinical criteria, and TCM eligibility is event-driven (acute-care discharges).

Steady-state
assumption
Annual panel revenue is annualized at full enrollment. Enrollment ramps over the first two quarters following the 60-day go-live; first-year actual revenue is typically a fraction of the steady-state figure shown.

Hospital vs.
practice math
Calculator outputs are gross Medicare revenue. For practices, you stay provider of record and keep the reimbursement, less CareAtlas's per-enrolled-patient platform fee — which is a fraction of the reimbursement, so net economics stay strongly positive. For hospital partnerships, CareAtlas serves as provider of record and the value lands as reduced readmissions (and the penalties they drive); the specific partnership economics are structured per engagement and modeled to your discharge volume.